This paper provides an introduction to singular spectrum analysis and This section provides a brief theoretical background on singular spectrum analysis
18 pages
Missing: introa | Must include: introa
135 KB – 18 Pages
PAGE – 1 ============
1 SAS586-2 017 Automatic Singular Spec trum Analysis and Forecasting Michael Leonard and Bruce Elsheimer SAS Institute Inc., Cary, NC, USA ABSTRACT The singula r spectrum analysis (SSA) method of time series analysis applies nonparametric techniques to decompose time series into principal components . SSA is particularly valuable for long time series , in which patterns (such as trends and cycles) are difficul t to visualize and analyze . An important step in SSA is determining the spectral groupings ; this step can be automated by analyzing the w-correlations (weighted correlations ) of the spectral components . This pape r provides an introduction to singular spectrum analysis and demonstrates how to use SAS/ETS ® software to perform it. To illustrate, monthly data on temperatures in the United States for about the last 100 years are analyzed to discover significan t patterns. INTRODUCTION Time series data often contain trends , cycles , anomalies , and other components . For long time series, these patterns are often difficul t to visualize and discove r. Singular spectrum analysis (SSA) applies nonparametric techniques that adap t the commonly used principal component analysis (PCA) for decomposing time series data. The principal components can help you discover and understand the various patterns that the time series contains. After you understand each o f these componen t series , you can model and forecas t them separat ely; then you can aggregate the componen t series forecasts in order to forecas t the original series unde r investigation. SSA requires grouping of the eigenspectrum . In the past , this grouping was performed manually . Based on w-correlation analysis , the spectral grouping can be performed automatically. BACKGROUND This section provides a brie f theoretical background on singular spectrum analysis. It is intended to provide the analyst with motivation , orientation , and references. An introductory discussion of singula r spectrum analysis can be found in Golyandina , Nekrutkin , and Zhigljavsky (2001) and in Elsner and Tsonis (1996). This section extends the discussion found in Leonard , Elsheime r, and Kessler (2010). Traditiona l Singular Spectrum Analysis Given a time series for and a window length , singular spectrum analysis decomposes the time series into spectral groupings by using the following steps: 1.Embedding step: Using the time series, form a trajectory matrix such that for and , where . By definition, because .2.Decomposition step: Apply singular value decomposition to the trajectory matrix , where represents the matrix that contains the left-hand-side (LHS) eigenvectors, represents the diagonal matrix that contains the singular values, and represents the matrix that contains the right- hand-side (RHS) eigenvectors. Therefore, , where represents the principal component matrix, represents the left-hand-side (LHS) eigenvector, represents the singular value, and represents the right-hand-side (RHS) eigenvector that is associated with the lth window index. 3.Grouping step: For each group index, define a group of window indices . Let represent the grouped trajectory matrix for group . Note that if groupings represent a spectral partition, and for all , then according to the singular value decomposition theory, .
PAGE – 2 ============
2 4. Averaging step: For each group index, compute the diagonal average of , where for for for Note that if groupings represent a spectral partition, and for all , then by definition. Hence, singular spectrum analysis additively decomposes the original time series, , into compon ent series: for 5. Forecasting s tep ( optional ): If the groupings represent a spectral partition, then each component series, for , can be modeled and forecasted independently using an appropriate time series model (ARIM AX, u nobserved c omponent m odel, e xponential s moothing m odel, and others) , possibly using di fferent time series models that include different input series (causal factors) and calendar events (interventions). Let for represent the component series forecasts that are derived from the m th independent time series model. Then the forecast for the original time series, , can be derived by simply aggregating the component series forecasts: . The SSA forecasting step represents a clever forecast model combination technique. Automatic Spectral Grouping An important step in SSA is specifying the groups, for . In order to automate the SSA grouping step, the w – correlations are computed to form an w – correlations matrix , assuming the maximal number of groups: . where , , and The following steps are performed in SSA auto grouping: 1. Initially assume the maximal number of groups: . 2. Diagonally average the groups as described previously: for 3. Compute the w – correlations between groups: . 4. Choose the groups based o n the w – correlations for which the absolute values are near 1 . Or more formally, such that whenever After the groups have been chosen based on the w – correlatio n analysis, group according to step 3 , a verage diagonally according to s tep 4, and op tionally forecast according to s tep 5. SAS IMPLEMENTATION The singular spectrum analysis described in the previo us section can be performed using SAS/ETS software. This section describes how the TIM ESERIES procedure analyzes time stamped and time series data. PROC TIMESERIES Statement The PROC TIMESERIES statement has the following options that are related to SSA (for options related to other analyses, see the ) : OUTSSA= SAS – data – set names the output data set to contain the singular spectrum analysis result series. PLOTS=SSA plots the singular spectrum analysis results.
PAGE – 3 ============
3 PRINT=SSA prints the singular spectrum analysis results. SSA STATEMENT You can use the new SSA statement in the TIMESERIES procedure to specify options that are related to singular spectrum analysis (SSA) of the accumulated time series. Only one SSA statement is allowed. The SSA s tatement has the following syntax: SSA < / options > ; You can specify t he following options in the SSA statement fo llowing the slash (/): LENGTH= number specifies the window length to be used in the analysis, w here number represents the maximum lag used in the SSA trajectory matrix. The number must be greater than 1 and less than 1 , 000. When the SEASONALITY= option is specified or implied by the INTERVAL= option in the ID statement , the default window length is the smaller of two times the length of the seasonal cycle and one – half the length of the time series. When no seasonality value is available , the default window length is the lesser of 12 and one – half the length of the time series. For example, the following SSA statement specifies a window length of 10: ssa / length=10; As another example, the following SSA statement specifies a window length of 24 if the INTER VAL=MON TH or SEASONALITY=12 option is specified: ssa; If the specified window length is greater than what is feasible based on one – half the length of the accumulated time series, the window length is reduced and a warning message is printed to the log. THRESHOLD= percentage specifies the threshold value used to determine the size of the last group based on the cumulative percent age of the singular values. The percentage must be greater than 0 and less than 100. The default is 90% (THRESHOLD=90). For example, the following SSA statement specifies a threshold of 80%: ssa / threshold=80; As another example, the following SSA statement specifies a threshold of 90%: ssa; The size of the last group must be at least 1 but less than the window length , and the threshold is adjusted to achieve this requirement. For example, the following SSA statement specifies a threshold of 0% and implies that the size of the last group is 1 less than the window length: ssa / threshold=0; As another example, the following SSA statement specifies a threshold of 100% and implies that t he size of the last group is 1 : ssa / threshold=100; GROUPS= specifies the list of groups of window lags to be stored in the OUTSSA= data set or plotted. The window lags mu st be separated by spaces or commas. For example, GROUPS=(1 3) (2 4) specifies that the first and third window lags form the first group and the second and fourth window lags form the second group. The default is to evenly divide the window into two groups based o n the window length, which is specified in the LENGTH= option. For example, the following SSA statement specifies three groups:
PAGE – 4 ============
4 ssa / groups=(1 3)(2 4 5)(6); The first group contains the first and third principal components ; the second group conta ins the second, fourth, and fifth principal components ; and the third group contains the sixth principal component. For example, the following SSA statement specifies two groups: ssa; The first group contains the pri ncipal components whose spectra sum to greater than the threshold of 90% ; the second group contains the remaining principal component s . GROUPS= AUTO (number) specifies the maximal number of groups to be retained when automa tic grouping is used. When the GROUPS=AUTO ( number ) option is specified , groups are created automatically based on the w – correlations . Specifying the Window Length You can explicitly specify the maximum window length, by using the LENGTH= option in the SSA statement, or you can implicitly specify the window length by using the INTERVAL= option in the ID statement or the SEASONALITY= option in the PROC TIMESERIES statement. In any case, the window length is reduced based on the accumulated time series length to enforce the requirement that Specifying the Groups You can explicitly specify the grouping by using the GROUPS= option in the SSA statement, or you can implicitly specify the grouping by using the THRESHOLD= option in the SSA statement. The THRESHOLD= option is useful for r emoving noise or less dominant patterns from the accumulated time series. Let be the cumulative percent age singular value threshold. Then (the last group) is determined by the following threshold: wher e where Using this rule, the last group describes the least dominant patterns in the time series , and the size o f the last group is at least 1 and is less than the window length, MANUAL SPECTRAL GROU PING EXAMPLE To illustrate the use of SSA in SAS/ETS software, monthly data on US t emperatures for about the last 100 years are analyzed to find significant patterns. The analysis of this example illustrates how spectral grouping is man ually performed. This example is found in Leonard, Elsheimer, and Kessler (2010) and is repeated here for convenience. BASIC TIME SERIES AN ALYSIS The monthly temperature anomaly ( in degrees Celsius) for the U nited States over the last 128 years , which was provided by the National Ocean ic At mospheric Administration (NOAA), was analyzed. The temperature anomaly is seasonally adjusted by using the reference decade of the 1960s. F irst , the time series was plotted using the TIMESERIES procedure as follows : proc timeseries data=NOAA out=_NULL_ plot=(SERIES CYCLES); id DATE interval=MONTH; var TEMPERATURE; run; DATA=NOAA specifies that the data set W ork .NOAA contains the temperature anomaly records. The ID statement specifies that the time ID variable is DATE and the time interval is MONTH. The VAR statement specifies that the
PAGE – 5 ============
5 variable under analysis is TEMPERATURE. The PLOT=(SERIES CYCLES) option plots the s eries and the year – over – year monthl y cycles . Figure 1 il lustrates the SERIES plot. The X axis represents the time ID (DATE) , and the Y axis represents the temperature anomaly (TEMPERATURE). As you can see from this plot, it is difficult to see any patterns in the time series because of its length and variation. Figure 1 . Monthly Series Plot of the Temperature Anomaly
PAGE – 6 ============
6 Figure 2 illustrates the year – over – year monthly cycles plot (CYCLES). The X axis represents the monthly seasonal d the Y axis represents the temperature anomaly (TEMPERATURE). Each line represents one year (128 seasonal cycles). As you can see from this plot, the series has no discernible monthly pattern as expected , because the time series is seasonally adjusted. Figure 2 . Seasonal Cycles Plot of the Temperature Anomaly SINGULAR SPECTRUM ANALYSIS Next, singular spectrum analysis is applied using a threshold value for the eigenspectrum. The time series is analyzed using the TIMESERIES proc edure as follows: proc timeseries data=noaa out=_NULL_ plot=(series cycles SSA); SSA / LENGTH=120 THRESHOLD=80; id date interval=month; var temperature; run; The LENGTH=120 option in the SSA statement specifies a window length of 120 (10 years) , and the THRESHOLD=80 option specifies an eigenspectrum threshold value of 80%. Including SSA as one of the values in the PLOT= option plots the SSA analysis .
PAGE – 8 ============
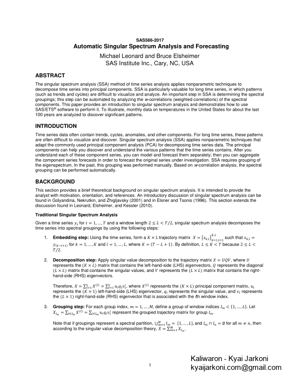
8 Figure 4 illu strates the first group. In the upp er graph, the jagged blue line represents the original series , and the smooth blue line represents the first group. In the lower graph, the blue line represents the first group. As you can see from the plot, the first group represents the dominant trend in the temperatur e anomaly series. From these graphs , it appears that temperatures have increased about one degree over about the last 100 years . Figure 4 . First Spectral Group of the Temperature Anomaly
PAGE – 10 ============
10 Figure 6 illustrates the spectral density plot for the second gr oup. From this plot, there appears to be a n approximately 22 – year cycle ( SEASONALITY=264 ), possibly related to the Hale solar cycle. Figure 6 . Spectral Density of the Second Spectral Group
PAGE – 11 ============
11 Figure 7 illustrates the third grou p. As you can see from these graphs , the third group represents the dominant short – term cycle in the temperature anomaly series. It appea rs that the variation is small for the reference decade of the 1960s. Figure 7 . Third Spectral Group of the Temperature Anomaly
135 KB – 18 Pages