by B Khatua · 2021 · Cited by 4 — dietary patterns, we performed a meta-analysis modeling the effect of obesity on severity of acute pancreatitis, in.
194 KB – 17 Pages
PAGE – 1 ============
1 of 16IMMUNOLOGYAdipose saturation reduces lipotoxic systemic inflammation and explains the obesity paradoxBiswajit Khatua1, Bara El-Kurdi1, Krutika Patel1, Christopher Rood2, Pawan Noel1, Michael Crowell1, Jordan R. Yaron1, Sergiy Kostenko1, Andre Guerra1, Douglas O. Faigel1, Mark Lowe3, Vijay P. Singh1*Obesity sometimes seems protective in disease. This obesity paradox is predominantly described in reports from the Western Hemisphere during acute illnesses. Since adipose triglyceride composition corresponds to long-term dietary patterns, we performed a meta-analysis modeling the effect of obesity on severity of acute pancreatitis, in the context of dietary patterns of the countries from which the studies originated. Increased severity was noted in leaner populations with a higher proportion of unsaturated fat intake. In mice, greater hydrolysis of unsaturated visceral triglyceride caused worse organ failure during pancreatitis, even when the mice were leaner than those having saturated triglyceride. Saturation interfered with triglyceride™s interaction and lipolysis by pancreatic triglyceride lipase, which mediates organ failure. Unsaturation increased fatty acid monomers in vivo and aqueous media, resulting in greater lipotoxic cellular responses and organ failure. Therefore, visceral triglyceride saturation reduces the ensuing lipotoxicity despite higher adiposity, thus explaining the obesity paradox. INTRODUCTIONWhile quantitative parameters such as body mass index (BMI) (1), waist circumference, and amount of visceral adipose ( 2,˜3) are well-studied risk factors for acute disease severity, the impact of adipose compo-sition on severity is unclear. Organ failure, the hallmark of acute pancreatitis (AP) severity, has been associated with long-chain non -esterified fatty acid (NEFA) lipotoxicity in humans (4Œ7). Clues to the role of adipose composition in severity come from studies from Western populations showing a BMI of˜>30 mostly, but not always (2,˜3) associated with severity, while in Eastern populations, much lower BMIs, sometimes ˚23 ( 8,˜9), are associated with severity. This fiobesity paradoxfl (10) also occurs in other acute scenarios such as burns (11), acute heart failure (12), after trauma (13), cardiovascular surgery (14), and during critical illnesses (15) in which elevated pancreatic enzymes ( 16Œ18) and long-chain NEFA (19,˜20) have been associated with severity. More recent studies associate such an enzyme leak (21) and dietary fat composition (22), along with elevated NEFA levels, to the severity (23) and mortality from coronavirus disease 2019 (COVID-19) ( 22,˜24). However, the mechanisms determining NEFA generation and how NEFA mediate outcomes such as the cytokine storm (24) and organ failure (19,˜20,˜22) are unclear.Most individual studies supporting the obesity paradox come from the Western Hemisphere (12Œ14), where dietary and adipose fat are more saturated ( 25,˜26). We therefore aimed at understanding this problem in different populations, by modeling AP, wherein the pancreatic lipases leak into the surrounding fat (6,˜7,˜27) and hydrolyze the neutral lipids (7). Principal among these lipases is pancreatic triglyceride lipase (PNLIP), which enters visceral adipocytes by various mechanisms (7) and mediates lipotoxic systemic injury along with organ failure (7,˜28) via the generated long-chain NEFA (7,˜28) inhib -iting mitochondrial complexes I and V (6). However, the impact of long-chain NEFA saturation on systemic inflammation is unknown.We therefore approached the obesity paradox by examining vis-ceral fat composition as influenced by dietary fat composition (29). Epidemiologically, all clinical reports up to 2017 associating AP severity with BMI were grouped by cutoff BMI, and the dietary fat composi-tion representative of the country from which the study originated was studied. The dietary fat data were based on publicly available information archived by the Food and Agriculture Organization (FAO) and were classified as saturated or unsaturated based on the presence of double bonds in long-chain (>12 carbon) NEFA com-posing the dietary triglycerides (described in Methods). After analyz -ing the human metadata, we tested the plausibility of fat composition affecting the outcomes of pancreatitis by altering mouse visceral fat composition to replicate human visceral fat ( 25,˜26,˜29). Unexpectedly, the human and experimental models cumulatively showed that the U.S. Food and Drug Administration (FDA)Œrecommended higher unsaturated fat intake (https://health.gov/dietaryguidelines/2015/resources/2015-2020_Dietary_Guidelines.pdf; https://www.fda.gov/files/food/published/Food-Labeling-Guide-%28PDF%29.pdf, appen-dix F) increased the risk of severe AP (SAP). We therefore investigated the mechanistic basis of this finding and noted that saturation of a triglyceride makes its interaction with PNLIP energetically unfavor-able and reduces its lipolysis. Moreover, in general, unsaturated NEFAs achieved higher monomeric concentrations in˜vivo and aqueous systems, consequently eliciting stronger biological responses and causing worse injury and organ failure. These features may explain how obese populations with higher visceral fat saturation may sometimes be protected from severe disease. RESULTSHigher saturated fat intake is associated with SAP at a higher BMI As seen in Fig.˜1A and fig. S1, 20 reports from 11 countries used a BMI cutoff of ˚30 to stratify SAP. Six of these (blue countries and text in table) reported no increased risk (2,˜3,˜30Œ34), while the 14 (golden text and green countries) reported an increased risk of SAP at BMI of ˚30 (1,˜6,˜35Œ44). Six reports used a cut off BMI of 25 or 1Department of Medicine, Mayo Clinic, Scottsdale, AZ, USA. 2Saint Louis University School of Medicine, Saint Louis, MO, USA. 3Department of Pediatrics, Washington University School of Medicine, Saint Louis, MO, USA.*Corresponding author. Email: singh.vijay@mayo.eduCopyright © 2021 The Authors, some rights reserved; exclusive licensee American Association for the Advancement of Science. No claim to original U.S. Government Works. Distributed under a Creative Commons Attribution NonCommercial License 4.0 (CC BY-NC).
PAGE – 2 ============
2 of 16less ( 8,˜9,˜45Œ49). Adult AP typically occurs after the third decade (50,˜51). Since the composition of visceral fat necrosed during AP may be influenced by the dietary fat composition over the preced -ing years (26), we analyzed dietary fat composition of different countries shown in Fig.˜1A. The per capita fat consumption was calculated by averaging the yearly data (1970 to 2011) for each country. Countries with a BMI cutoff of ˚30 had higher per capita saturated fat consumption (Fig.˜1B and fig. S1). While the amount of unsaturated fat consumption was the same (fig. S3A), unsatu -rated fat comprised a higher percentage of fat intake in the coun-tries with reports having a cutoff BMI of ˛25 (pink countries; Fig.˜1,˜A˜and˜C). Overall, there was a moderate correlation between the percentage of patients with SAP and the percentage of unsatu -rated fat intake (fig. S3B). On meta- analysis (Fig.˜1D), a significantly increased risk of severity was noted for cutoff BMIs of ˛25 [pink shade, odds ratio (OR) 2.8, CI 1.3 to P = 0.008] and also BMI of >30 (blue and greens, OR 2.7, CI 1.8 to 3.8, P < 0.001). Publication bias was not detected on the basis of a Funnel plot (fig. S1C), an Egger™s regression, or a Begg and Mazumdar rank correlation. There were no differences in age, sex distribution, or etiology of AP between the two groups (fig. S1). While the effect of genes and comorbidities on %SAP cannot be commented on in these data, meta-regression showed that %unsaturated fatty acid (UFA) was able to explain 33% of the heterogeneity in the rate of SAP, and neither age, AP etiology, nor per capita gross domestic product (GDP) correlated with SAP. Furthermore, while per capita GDP of countries averaged for 5 years preceding publication was significantly lower in countries reporting SAP at BMIs of ˛25 ($15,768˜±˜14,624 versus $32,272˜±˜17,007, P˜=˜0.018), neither mortality (5.2˜±˜6.9 versus 6.7˜±˜4.3%, P˜=˜0.698) nor the proportion of patients with SAP (24˜±˜12.5 versus 20.7˜± 8.4%, P˜=˜0.892) was different in the two BMI cutoff groups. Therefore, despite differences in income, the proportion of SAP and mortality were unchanged. This implied that quality of care was not differ -ent in the two groups of countries. Overall, these studies supported Fig. 1. Relationship of human SAP to cutoff BMI and composition of dietary fat intake. (A) Studies using a BMI cutoff of ˜25 are shown in pink, those associating SAP with a BMI of ˚30 are shown in gold, and studies showing a BMI of >30 was not associated with severe AP (SAP) are show shown in blue. The respective countries from which the study originated are shown in pink, green, and blue, with a checkered pattern for countries with studies showing different outcomes. Box plot comparing the per capita per year saturated fat (from dairy, cattle, and palm oil) consumption in countries with BMI cutoffs of >30 and those with ˜25 BMI (B) and %UFA in dietary fat intake (C). (D) Meta-analysis showing OR for SAP for studies using a BMI cutoff of ˜25 (pink background) and those using a BMI cutoff of >30 (blue-yellow background). The overall OR is shown at the bottom (orange background).
PAGE – 3 ============
3 of 16that severe pancreatitis occurred at a lower BMI in countries with a lower dietary saturated fatty acid (SFA) intake. Since we are not aware of the literature on how diet would affect the genetic background of a population over several generations to alter the severity of pan -creatitis, we therefore went on to experimentally study whether and how altering visceral fat composition affected the development of SAP in the commonly used caerulein (CER) model of AP, which, in lean C57BL6 normal chow-fed mice, remains mild, self-limited, and without organ failure (27).Dietary unsaturated fat results in unsaturated visceral fat and worsens AP more than higher amounts of saturated visceral fatWe first aimed at recapitulating the human studies showing that dietary fat composition can change adipose tissue composition in an animal model (26). Linoleic acid (LA; C18:2) is an unsaturated essential fatty acid (i.e., only available through diet) present at high concentrations in common FDA-recommended dietary fats (52) (e.g., cooking oils) and comprises a high proportion in pancreatic fat necrosis (FN) (5,˜6). Being essential, LA™s concentrations in visceral fat parallel dietary intake (29). We thus formulated a diet enriched in LA (70% LA in a 45% fat diet) to represent high %UFA intake in dietary fat (red box in fig. S4A and Fig.˜2A1, red columns) (26,˜52). Similarly, a diet enriched in saturated fat was formulated, which had palmitic acid (PA; C16:0, PA 68% of a 47% fat diet; fig. S4B, green rectangle) replicating the 65 to 70% saturation of dairy fat. These diets spanned the range of %UFA intake in humans (16% in Australia and 79% in Japan), as shown in fig. S3A.Mice fed these diets had a similar food intake (6.5˜±˜1.4 g/day of UFA diet or 6.3˜±˜0.5 g/day of SFA diet). This altered their visceral triglyceride composition, with LA and PA increasing to 40 to 45% (Fig.˜2A1 and detailed in fig. S5) in the UFA- and SFA-fed groups, respectively. We previously showed that a normal chow diet with 5% fat diet (Purina 5053), which contains ˚70% UFA and˜<20% SFA Fig. 2. Dietary and adipose fat composition and parameters of local, systemic severity of CER pancreatitis in UFA- and SFA-fed ob/ob mice. (A1) Table comparing the fatty acid composition of fat pad triglycerides (TG) and diets of mice given the SFA- and UFA-enriched diets. Body weights (A2), body fat (A3), and body fat as a per-centage of body weight (A4) in the SFA- and UFA-fed mice. Serum amylase (B1) and lipase (B2) in control (CON) mice and after 24 hours of AP (CER). Local pancreatic in-jury seen histologically (C1) and quantified as acinar necrosis (C2) as a percentage of total parenchymal area and percentage of acinar necrosis adjacent to the FN (shown in yellow rectangles), termed as fi% peri-fat acinar necrosisfl ( C3). Systemic injury measured as renal injury [TUNEL staining showing brown nuclei in (D1) and serum BUN in ( D2)], lung TUNEL positivity highlighted with arrows in ( D3), and shown as number per high-power field (HPF) in ( D4), along with shock (as measured by a drop in carotid pulse distention) in ( E1), serum calcium (E2), and survival curve (E3) of mice with CER AP. NS, not significant.
PAGE - 4 ============
4 of 16consistent with FDA recommendations, results in fat pad tri-glyceride to be composed of 18˜±˜6% PA and 31˜±˜14% LA, with 35˜±˜6% oleic acid (OA), i.e., C18:1˜in ob/ob mice ( 7). On feeding the special diets, the LA concentrations in the fat pads of the UFA- and SFA-fed ob/ob mice correspondingly matched reports of those in human adipose tissue from Japan [˝40% (25)] and the United States [5% ( 26)]. By 8 to 14 weeks, the mice averaged 45.5˜±˜0.5 g in both groups. CER AP reduced survival to 10% in the UFA group by day 3 versus 90% in the SFA group (P˜<˜0.02; fig. S6). We then sim -ulated the lower cutoff BMI (˛25) associated with SAP in countries with a higher %UFA intake. AP was initiated in UFA-fed mice weighing 20 to 30% less and having 35 to 40% less adipose tissue (Fig.˜2, A2 to A4). AP increased serum amylase and lipase similarly in both groups (Fig.˜2, B1 and B2) but was worse in the leaner UFA group. The SFA group has lesser pancreatic necrosis (5.8˜±˜0.8 versus 16.8˜±˜4.7%, P˜=˜0.024; Fig.˜2, C1 and C2) especially bordering FN, termed peri-fat acinar necrosis (2.7˜±˜0.4 versus 6.9˜±˜1.6%, P˜=˜0.03; green outline, Fig.˜2, C1 and C3). Consistent with SAP ( 53,˜54), the UFA-fed mice had greater lung and renal tubular TUNEL (terminal deoxynucleotidyl transferaseŒmediated deoxyuridine triphosphate nick end labeling) positivity, higher serum blood urea nitrogen (BUN) levels (Fig.˜2, D1 to D4), a greater decrease in carotid pulse distention (consistent with shock), and SAP-associated hypocalcemia (55,˜56) (Fig.˜2, E1 and E2), resulting in 20% survival ( P˜<˜0.02 versus 90% in the SFA group; Fig.˜2E3). The findings of SAP were replicated in UFA-fed C57BL6 mice with diet-induced obesity (DIO), but not the normal chow-fed mice (30.8˜±˜0.7 g), which had mild pancreatitis (fig. S7, A to F) (27). However, we did not use DIO as the primary model since the time to weight gain (>5 months) was prolonged.Preferential lipolysis of unsaturated long-chain triglycerides worsens inflammation and systemic injuryIt has recently been shown that PNLIP mediates FN and severity of AP (7). To understand the worse outcomes in UFA-fed mice, we compared the necrosed gonadal fat pads in both groups (Fig.˜3A). Grossly, the SFA group has reduced FN; however, the pancreatic amylase, lipase activity, and PNLIP protein (6- to 14-fold control) had a large increase in both groups (Fig.˜3, B1 and B2, and fig. S8A). Fig. 3. Effect of visceral fat composition on its lipolysis and associated inflammatory response. (A) Gross appearance of the FN in SFA-fed (top) and UFA-fed mice with pancreatitis. (B1) PNLIP, IKB-a, and a-tubulin (a-Tub) amounts on Western blotting (B2) in the fat pads of SFA- or UFA-fed control (Con) mice or those with CER pancreatitis (CER). Cytokine mRNA levels in fat pads ( C1) shown as an increase over control levels or serum levels of IL-6 ( C2), MCP-1 ( C3), or TNF- a ( C4) in control mice or those with CER pancreatitis after they had been fed with UFA- or SFA-enriched diets. Serum NEFA showing OA (D1), LA (D2), total serum UFA (C3), total serum NEFA (D4), PA (D5), palmitoleic acid (D6), total serum SFA (D7), and serum SFA as a percentage of total NEFA (D8) in control mice or those with CER pancreatitis after they had been fed with UFA- or SFA-enriched diets. Photo credit: Krutika Patel, Mayo Clinic, AZ.
PAGE – 5 ============
5 of 16The UFA mice had a larger cytokine mRNA increase in the fat pads during AP and interleukin-6 (IL-6), monocyte chemoattractant protein-1 (MCP-1), and tumor necrosis factorŒa (TNF-a) proteins in the sera (Fig.˜3, C1 to C4), which correlated with lower I kB-a (42˜±˜15% of controls, P˜<˜0.05) in the necrosed UFA fat pads (Fig.˜3B2).Since NEFA mediates cytokine increase (7), we measured serum NEFA to understand the underlying mechanism. The UFA group with AP had higher serum NEFA increase, especially UFAs, includ-ing C18:1 (OA) and C18:2 (LA) (Fig.˜3, D1 to D4). This pattern has been noted during SAP-induced organ failure (7,˜28,˜53,˜54) in both rodents ( 5,˜6,˜27) and humans ( 4). However, inexplicably, the in -crease in C18:1, C18:2, and C16:1 (Fig.˜3, D1, D2, and D6) was muted in the SFA-fed mice, despite C18:1 being equal and C16:1 being higher in the fat pads of the SFA group (Fig.˜2A1 and fig. S5). Simi -larly, C16:0 and SFA overall (Fig.˜3, D5 and D7, and fig. S8B) in -creased more in the UFA group, despite the SFA group having more of these in the visceral triglyceride, serum at baseline. The propor-tion of SFA in general went down with AP (Fig.˜3D8). This general -ized reduction in SFA release suggested that SFAs in triglyceride are an unfavorable substrate for PNLIP.We next directly investigated whether visceral triglyceride composition, irrespective of obesity or genetic background, affects its lipolysis and consequent severity during AP. For this experiment, the triglycerides of LA (C18:2), glyceryl trilinoleate (GTL), or PA (C16:0), i.e., glyceryl tripalmitate (GTP), were intraperitoneally giv -en to lean mice with a genetically dissimilar background than the C57Bl6 mice, i.e., lean CD-1 mice. Two mechanistically distinct AP modelsŠi.e., CER and IL12/18, both of which are mild in lean ro-dents (27,˜57)Šwere then induced (Fig.˜4 and fig. S9).Mice given GTL or GTP alone exhibited normal behavior, with no change in physiologic or biochemical parameters. During AP, neither GTL nor GTP affected the initial serum amylase or lipase increase (Fig.˜4, A1 and A2, and fig. S9, A1 and A2), which is similar Fig. 4. Effect of intraperitoneal GTL or GTP on IL12,18-induced pancreatitis in lean CD-1 mice. Serum amylase (A1), lipase (A2), and trends and survival (A3) during IL12/18 pancreatitis alone (IL12,18), with GTL (IL12,18 + GTL) or GTP (IL12,18 + GTP). Note similar amylase and lipase at day 2 in all groups and progressive worsening in the GTL group, which has reduced survival. (B1 to B3) Representative H&E-stained images of the pancreas of mice belonging to the groups mentioned below the image. Note the increased necrosis at the periphery of the lobules in IL12,18 + GTL group (black arrows). Box plots showing serum glycerol (C1) and NEFA (C2) concentrations in control (CON) mice and in the different pancreatitis groups. (D1 to D3) Representative TUNEL-stained images of the kidneys of mice belonging to the groups mentioned below the image. Note the increased positivity in the tubules of the IL12,18 + GTL group (black arrows), which also has a significantly higher BUN than other groups on ANOVA (*) (D4). Box plots of the serum resistin (E1), IL-6(E2), TNF-a (E3), and MCP-1(E4) control (CON) mice and in the different pancreatitis groups. * indicates significant-ly higher than control on ANOVA, and # indicates a significant reduction compared to the IL12,18 + GTL group.
PAGE - 6 ============
6 of 16to ob/ob mice given UFA or SFA diets (Fig.˜2, B1 and B2). The AP outcomes also paralleled the UFA and SFA groups (Figs.˜2 and 3) with 0% survival in the GTL groups versus 80 to 90% in the GTP groups (P˜<˜0.01; Fig.˜4A3 and fig. S9A3). The GTL group had worse pancreatic necrosis (Fig.˜4, B1 to B3, and fig. S9, B1 and B2), pre -dominantly at the periphery of the lobules exposed to the lipolytically generated LA, resembling peri-fat acinar necrosis (Fig.˜2, C1 to C3). The higher serum glycerol and corresponding NEFA in the GTL groups with AP (Fig.˜4, C1 and C2, and fig. S9, C1 to C3) supported preferential unsaturated triglyceride lipolysis. Serum BUN elevations, renal tubular injury (Fig.˜4, D1 to D4, and fig. S9, D1 and D2), lung injury (fig. S10, A and B), and profound hypotension noted as shock (fig. S10C) were only noted in the GTL groups with AP. Consistent with the small adipose tissue mass and visceral FN in lean mice (fig. S11, A1 and A2), there was no increase in serum resistin (Fig.˜4E1 and fig. S9E1) and little or no increase in serum lactate dehydrogenase (LDH) (fig. S11, B and E). However, consistent with NEFA-driven inflammation (7), serum IL-6, TNF-a, and MCP-1 were higher in both AP models with GTL (Fig.˜4, E2 to E4, and fig. S9, E2 to E4), perhaps due to the systemic lipotoxicity of LA noted as higher serum damage-associated molecular patterns (DAMPs), i.e., double- stranded DNA (dsDNA) and histone-complexed DNA fragments in the GTL groups with pancreatitis (fig. S11, C, D, F, and G). These findings suggested that unsaturated visceral triglyceride is hydrolyzed more than saturated triglyceride and worsens systemic inflammation and organ failure, consistent with what we note epidemiologically (Fig.˜1). We thus went on to study the mechanistic basis of this in more detail. Saturation reduces long-chain triglyceride lipolysis by pancreatic lipasesTo understand how visceral triglyceride composition influences AP severity, we simulated the in˜vivo AP-associated lipase leak into fat using an in˜vitro system (Fig.˜3, B1 and B2) ( 6,˜7,˜27). Acini release pancreatic enzymes into the surrounding medium under the basal state in˜vitro ( 58). Thus, we measured the hydrolysis of triglycerides added to the medium and biological responses of the NEFA generated.Addition of pure triglycerides GTP, glyceryl trioleate (GTO; the triglyceride of OA, C18:1), or GTL (300 mM each) to the stirred ac-inar medium in a quartz cuvette at 37°C resulted in 60 to 70% hy-drolysis of GTL and GTO within 15˜min but <10% of GTP (Fig.˜5, A1 and A2). Lipolysis of GTL and GTO, unlike GTP or GTLO (i.e., GTL + the lipase inhibitor orlistat at 50 mM) which has <15% lipoly -sis, also caused acinar mitochondrial depolarization (ym) and cyto-solic calcium (Cai) increase (Fig.˜5, A3 and A4). Separately, on longer incubation (6 hours), 80 to 100% of GTL was hydrolyzed to glycerol (fig. S12A) versus 20 to 30% of GTP even at a 3× molar excess. GTL hydrolysis caused cytochrome c leakage, decreased ATP (adenosine 5˙-triphosphate) levels, and increased LDH leakage and propidium iodide uptake (fig. S12, B to E). These studies showed that triglyceride saturation reduces its lipolysis and consequent biological effects.We then studied the effect of saturation on the hydrolysis of mixed triglycerides in the acinar medium, since triglycerides in˜vivo are mostly mixed. On the basis of pancreatic lipase lacking stereoselectivity for the sn-1/sn-3 position (59), we chose mixed triglycerides (each at 100 mM) of LA, i.e., 1,2-dilinoleoyl-3-palmitoyl-rac-glycerol (LLP) (LA-LA-PA), 1,3-dipalmitoyl-2-linoleoylglycerol (PLP) (PA-LA-PA), and 1-palmitoyl-2-oleoyl-3-linoleoyl-rac-glycerol (LOP) (LA-OA-PA), and compared these to GTL (LA-LA-LA). Palmitate disproportionately reduced lipolysis over 15˜min. For example, LLP generated <30% LA, and PLP generated <9% LA versus GTL (Fig.˜5B1). Both linoleate (4.3˜±˜1 mM) and oleate (4.4˜±˜1.2 mM) generation were markedly reduced on LOP. This was paralleled by reductions in ym and Cai increase (Fig.˜5, B2 and B3).Triglyceride saturation makes its lipolysis by PNLIP energetically and structurally unfavorableWe then studied the interaction and hydrolysis of GTL, LLP, and LOP focusing solely on triglyceride hydrolysis by human PNLIP in phosphate-buffered saline (PBS; pH 7.4, 37°C, 150 mM Na). The hydrolysis, i.e., GTL˜>˜LLP˜>˜LOP, paralleled those in the acinar cell media (Fig.˜5C1). We thus studied their interaction with PNLIP using isothermal titration calorimetry (ITC).A single injection of human PNLIP (0.7 nmol/s) into a stable, sonicated, stirred, and 100 mM suspension of these triglycerides in PBS (at 300 s; fig. S13A) caused an endothermic interaction with a magnitude paralleling lipolysis, i.e., GTL˜>˜LLP˜>˜LOP, the enthalpy of which paralleled the raw heat data (Fig.˜5, C2 and C3, and fig. S13B). The enzyme kinetics studied with multiple-injection experiments (fig. S13E) mirrored the above findings with the reaction rate ( V; micromolars per second) of GTL˜>˜LLP˜>˜LOP (fig. S13, F and G). The calculated kinetic parameters (fig. S13G) for GTL hydrolysis are similar to those previously published (60) and are more favorable than for LLP or LOP. Addition of orlistat (50 mM) to PNLIP signifi-cantly reduced the DH and Vmax in both types of injections (fig. S13, C, D, H, and I), supporting the relevance of the parameters to lipolysis. The above experiments thus showed that increasing satu -ration makes the interaction of unsaturated triglycerides with PNLIP energetically unfavorable, resulting in reduced lipolysis.To verify the experimental results in an independent unbiased manner, we undertook docking simulations using the open lid con-formation of the human PNLIP-procolipase complex (1LPA) (61) and studied access of the relevant triglycerides into the PNLIP ligand- binding domain (LBD) via the oxyanion hole. Ser152, Asp176, and His263 compose the catalytic triad of human PNLIP and are critical in fatty acid liberation from triglycerides. The closed conformation (1LBP) (62) was not used since our goal was not to study molecular dynamics of pancreatic lipase activation by interfaces.Previous in silico studies (63) found that orlistat, a potent lipase inhibitor, docks to pancreatic lipase with a GlideScore of ˆ6.90 kcal/mol with root mean square deviation (RMSD) between 1.2 and 4.8 Å. This value served as a threshold to quantify strong binding. To verify this value, we docked orlistat to 1LPA with the induced fit protocol, and a similar GlideScore value was produced. Orlistat docked with a distance of 3.74 Å between the catalytic serine and the b-lactone ring that inhibits PNLIP hydrolysis. The induced fit protocol docked GTL into the 1LPA LBD with a GlideScore of ˆ7.16 and with a distance of 4.04 Å between the hydroxyl group of Ser152 and the carbonyl C atom of the triglyceride™s glycerol backbone (Fig.˜5D1). LLP docked with a GlideScore of ˆ4.72 kcal/mol at a distance of 9.99 Å from Ser 152, and LOP and GTP respectively produced GlideScores of ˆ1.33 and˜ˆ1.58 while being 12.42 and 11.98 Å from the catalytic serine (Fig.˜5, D2 to D4). To verify the integrity of the docking simulation, the ligand present in the 1LPA crystal structure (61), dilauryl phos-phatidyl choline (DLPC), was removed and then docked with the same induced fit docking protocol used for the three triglycerides. DLPC docked with a GlideScore of ˆ7.46 (fig. S14A) and at a dis -tance of 3.59 Å from the hydroxyl group of the catalytic serine,
PAGE – 8 ============
8 of 16noted the critical micellar concentration (CMC) and therefore the aqueous monomeric NEFA concentrations to increase with the number of double bonds (Fig.˜6, F1 to F3). The CMCs of PA (C16:0), OA (C18:1), and LA (C18:2) were respectively <8, ˝40, and ˝160 mM, which paralleled the uNEFA levels in˜vivo (Fig.˜6D). The calorimetric results were then validated using ultracentrifugation. Both of these methods could be performed at room temperature (23°C; fig. S16) and showed that the nonmicellar NEFA concentrations in the in -franatents of 500 mM NEFA in PBS (pH 7.4), spun at 105g for 1 hour (fig. S16, A and B), were similar to the CMCs on calorimetry (fig. S16, C and D) and those shown previously using diphenyl hexatriene fluorescence spectroscopy (65). Thus, the CMC noted on calorimet-rically at 37°C (Fig.˜6, F1 to F3) are accurate.The role of uNEFA in causing biological effects was then studied in cells. Addition of 100 mM LA (below CMC) to pancreatic acini caused a larger increase in Cai (Fig.˜6G) and ym (Fig.˜6H) than 100 mM OA (above CMC). PA caused no change in these. A total of 0.5% albumin (Alb) completely aborted the Cai increase by both LA and OA and prevented ym from progressing (Fig.˜6,˜H˜and˜I). This effect of albumin proves that the Cai and ym increases were from the uNEFA. It also shows that Cai and ym changes result from distinct mechanisms of these uNEFA. The sustained ym elevation, without progression, despite albumin (Fig.˜6,˜H˜and˜I) signifying irreversible uNEFA toxicity, is distinct from the complete reversal of Cai by albumin (Fig.˜6G) and explains the cell death noted from LA or OA in previous studies ( 6). Therefore, the greater Cai and ym induced by LA than OA at 100 mM (Fig.˜6,˜G˜and˜H) may be due to LA™s higher CMC (Fig.˜6F3) and thus explains the higher uNEFA levels and shorter survival noted in LA-treated mice. We tested this by measuring the dose response of increase in ym over baseline Fig. 6. Effects of NEFA unsaturation on their in vivo effects and unbound monomeric behavior. Serum MCP-1 (A), BUN (B), NEFA (C), uNEFA (D), and dsDNA (E) after intraperitoneally administering C16:0 (green), C18:1 (blue), and C18:2 (red) as mentioned below the x axis. Values are at necropsy if moribund or euthanasia at 72 hours. (F1) ITC thermograms of injecting NEFA or solvent (0.34% DMSO for C16:0 and PBS for C18:1 or C18:2) at concentrations mentioned below the NEFA into PBS (pH 7.4) at 37°C, and corresponding enthalpograms (F2) and CMCs (F3) shown as shaded rectangles in the areas where they intersect the x axis. Effect of exogenous albumin (final concentrations of 0.5%) on the cytosolic calcium (Cai) (G) and mitochondrial depolarization (ym) (H and I) induced by 100 mM of the indicated NEFA added at 100 s. (J and K) Comparison of the dose responses of increase in mitochondrial depolarization (Dym) after 60 s of addition of different concentration of C18:1 (blue) or C18:2 (red) in acini (J) and HEK293 cells (K). * indicates significant difference (P < 0.05) from the previous lower concentration by paired t test. # indicates a significant difference between C18:2 and C18:1 for that specific concentration on t test.
PAGE - 9 ============
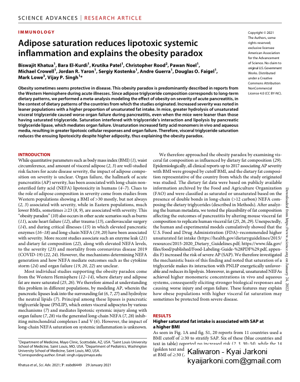
9 of 16(Dym) 60˜s after the addition of LA or OA to acini (Fig.˜6J) or human embryonic kidney (HEK) 293 cells (Fig.˜6K) to represent the pancreatic and kidney injury in˜vivo (Fig.˜4, D1 to D4, and fig. S9, D1 and D2). Consistent with OA™s CMC (˝40 mM; Fig.˜6F3), Dym increased over baseline at 50 mM OA (*) and then plateaued (Fig.˜6, J˜and˜K). Similarly, LA™s Dym increased till 100 mM and ceased at 200 mM, consistent with its CMC of ˝160 mM. While LA™s Dym equaled OA™s at 50 mM, it was more than OA™s (#) at concentrations of ˚100 mM. LA and OA (60 mM), unlike PA, also reduced endothelial barrier integrity (fig. S15, D and E), potentially explaining the hypo-tension (Fig.˜2E1 and fig. S10C) hypothesized to be from vascular leak during SAP (66), along with explaining the hypoalbuminemia (fig. S15, A to C) (55) in severe AP, and the uNEFA increase noted (Fig.˜6D). Overall, these studies cumulatively validate that double bonds in-crease monomeric long-chain NEFA concentrations and signaling in an aqueous environment, thus enhancing their lipotoxicity.DISCUSSIONHere, we find that a higher proportion of dietary unsaturated fat can worsen AP outcomes at a lower adiposity than seen in individuals with a higher proportion of saturated fats in their diet. We show that the higher likelihood of SAP associates with a higher unsaturated triglyceride content in visceral fat. This occurs because the presence of SFAs in triglycerides makes the interaction of the substrate with PNLIP structurally and energetically unfavorable. Moreover, the un -saturated NEFA generated by lipolysis can exist as monomers (65) in aqueous media, unlike saturated NEFA, resulting in injurious sig -naling, lipotoxic inflammation, and organ failure. This can potentially explain why higher dietary UFAs may result in worse AP in leaner animals and humans with lower BMIs compared to the more obese ones who consume a diet with higher proportions of saturated fat (Fig.˜7), resulting in the obesity paradox.We note that the obesity paradox in pancreatitis (10) holds true when the data are grouped and analyzed by BMIs using the World Health Organization (WHO) cutoffs ( 67) relevant to the countries from which the study originated (Fig.˜1), including those that use BMI cutoffs of ˛25, which have a lower SFA and higher %UFA con -sumption in diet (Fig.˜1,˜B˜and˜C). Socioeconomic and quality-of- care issues, age, sex, and etiology of AP are unlikely to have influenced our findings since the rate of SAP and mortality were the same in the >30 versus ˛25 BMI cutoff groups. We note that the SAP rates and %UFA intake have a moderate correlation (fig. S3B), and on meta-regression, %UFA intake explains 33% of the heterogeneity in SAP rates. Thus, other factors such as male sex, genetic background, and comorbidities that are not accounted for in the studies may contribute to the remaining heterogeneity in SAP rates.The difference in BMI cutoffs set by the WHO is commonly attributed to a higher percentage fat per body mass in Asian popu -lations compared to Caucasian populations (68). However, this is brought into question since visceral adiposity (3) that undergoes visceral FN during SAP (69) differs by ethnic groups (70) and in women versus men (71). We note that all visceral fat is not the same, since a higher proportion of diet-derived UFAs like LA make smaller Fig. 7. Schematic summarizing how dietary fat composition affects visceral fat necrosis and causes the obesity paradox. The impact of consuming a Western diet en-riched in saturated fat from dairy and red meat (left) or one enriched in unsaturated fat from vegetable oil and fish (right) are shown. In the event of AP, the relatively more saturated adipocyte triglyceride shown in blue ( , left) or unsaturated triglyceride shown in red ( , right) is exposed to pancreatic lipase, principal among which is PNLIP (zoomed circles). Despite being lesser in amount, the more unsaturated triglyceride is hydrolyzed more into the lipotoxic NEFA (), which are stable as monomers at higher concentrations than saturated NEFA, that form micelles () at lower concentrations. This results in worse systemic inflammation, injury, and organ failure in those with a higher unsaturated fat consumption, despite having less adiposity. This pathophysiology can explain the obesity paradox.
194 KB – 17 Pages